Debugging WebAssembly from Go sources in Chrome DevTools
By noops.land at
An interactive debugger is useful to better understand the behavior of an application or service by stepping through its code
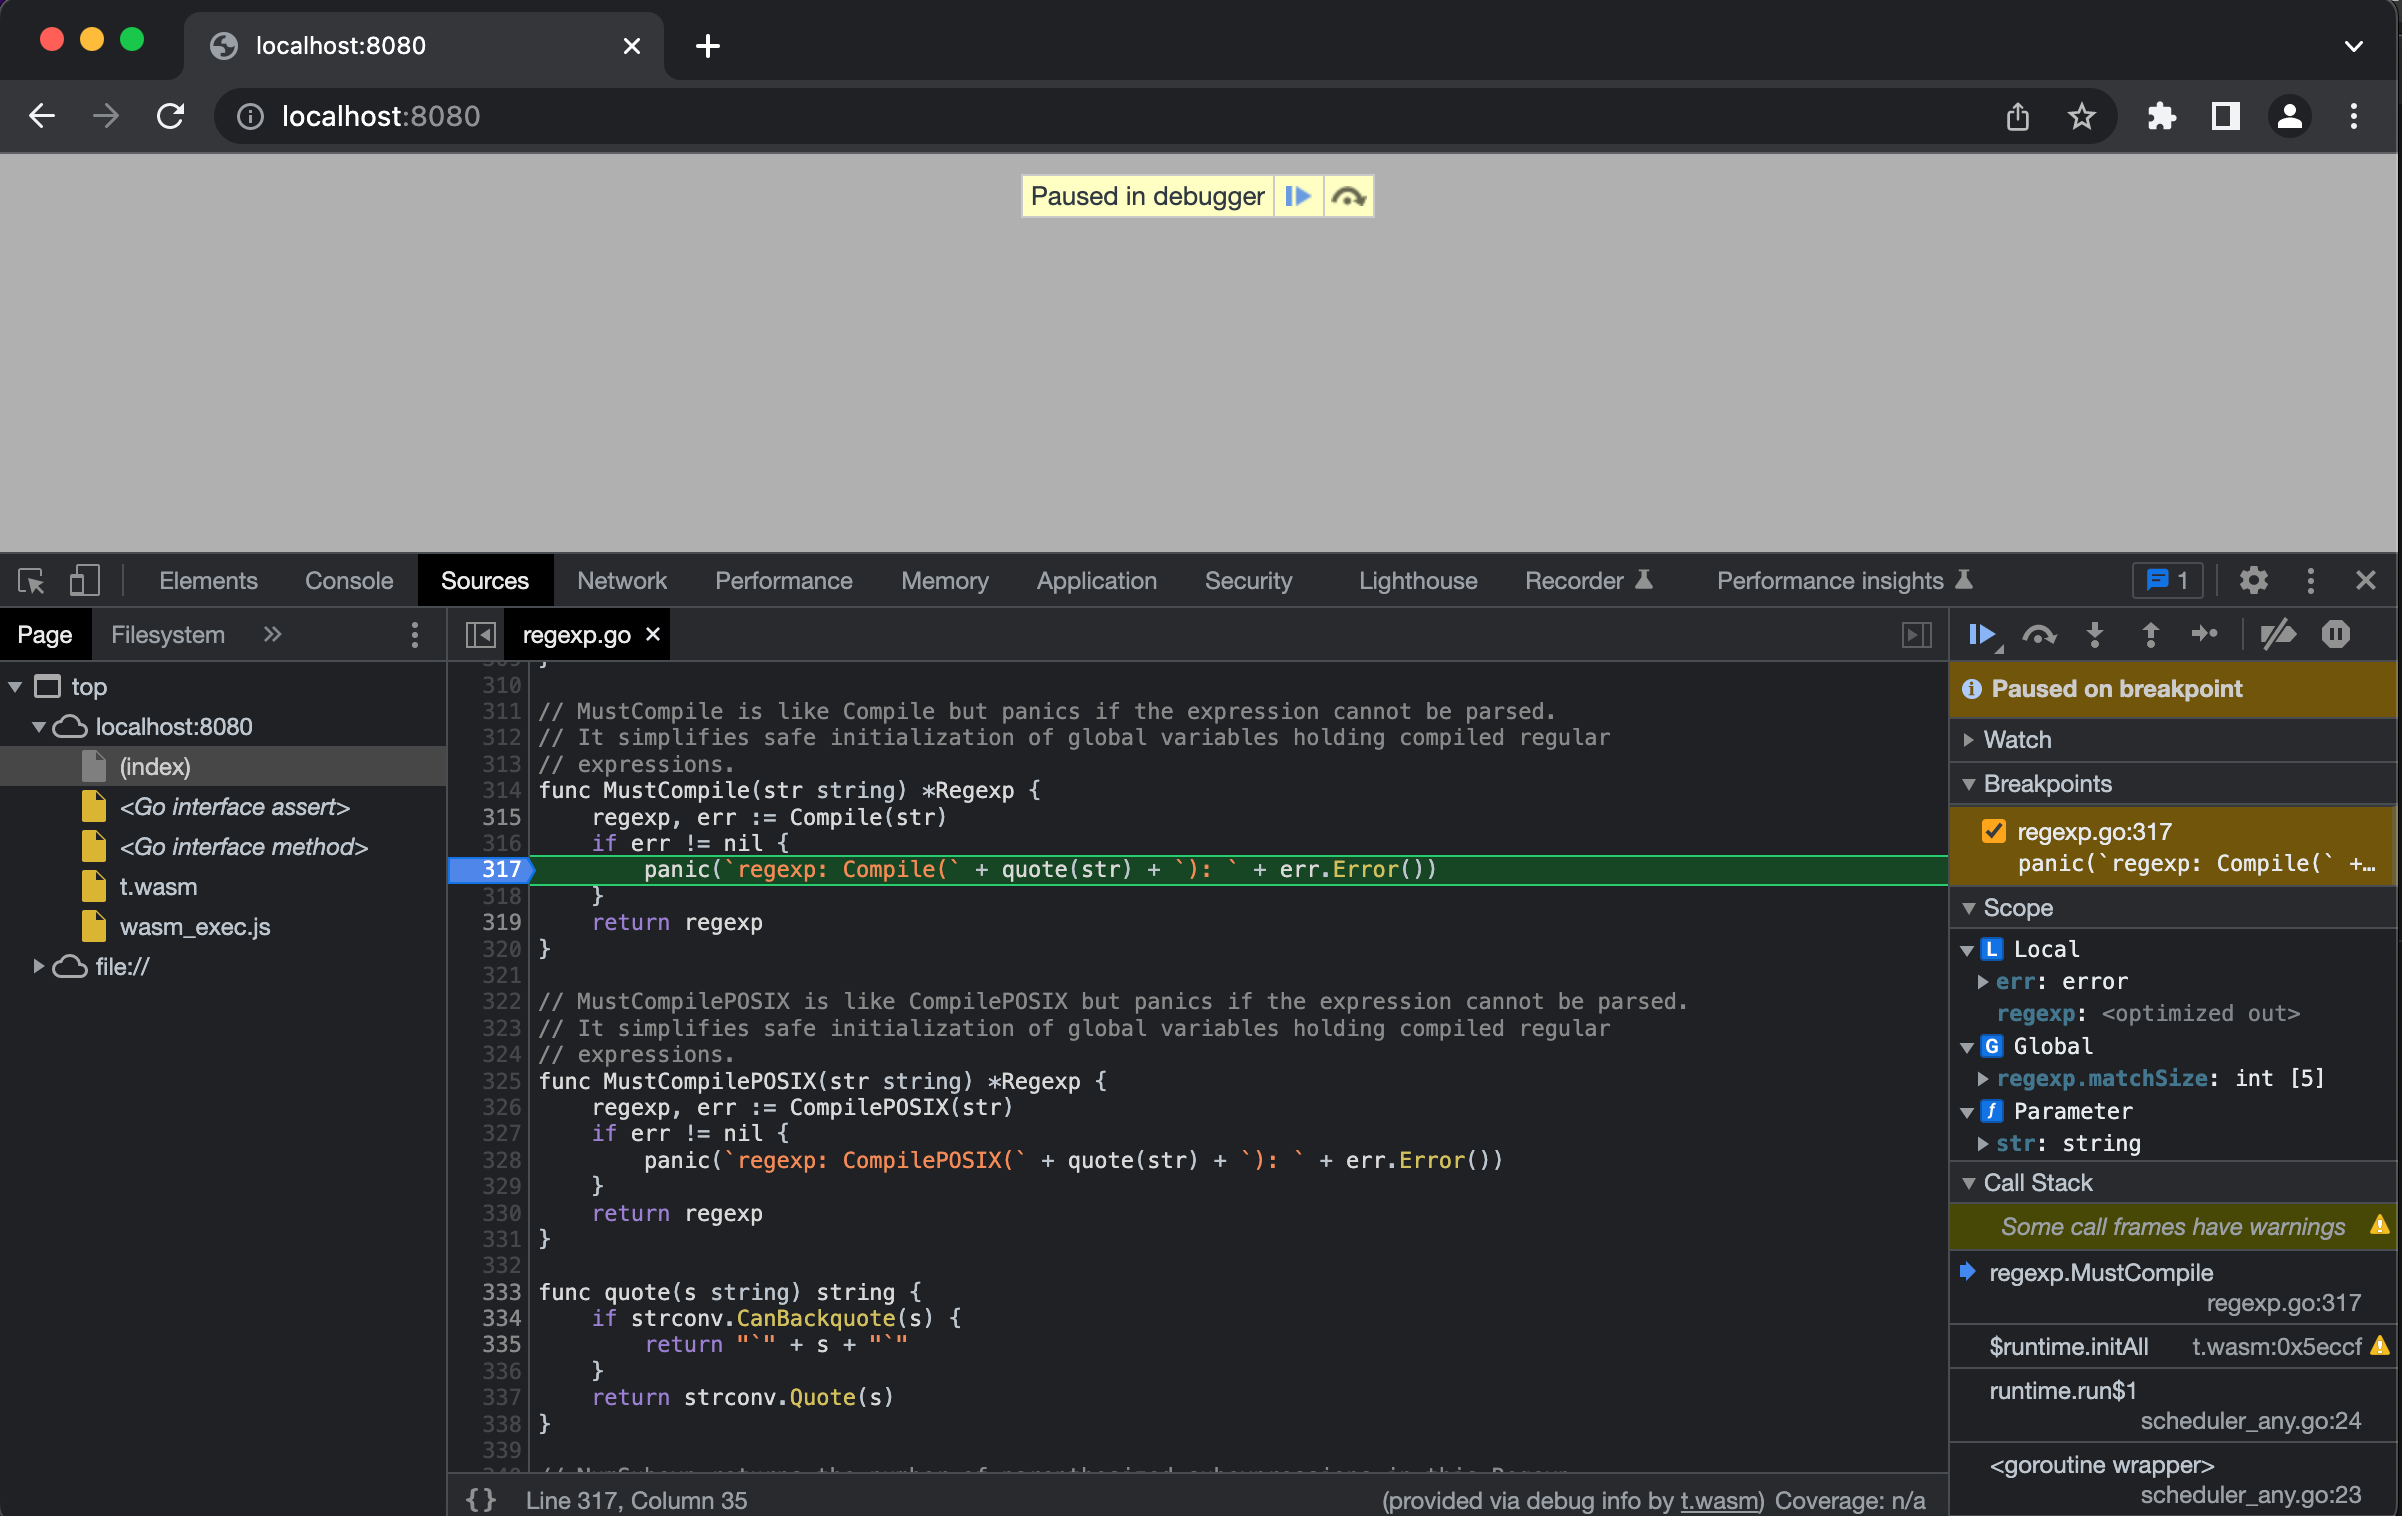
WebAssembly (Wasm) executables compiled from Go source code can be interactively debugged in Chrome DevTools, as shown in the following screenshot:
Currently, the built-in Go compiler does not export the debugging information needed by the Chrome debugger. The remainder fix to enable this functionality is described in this changelog
TinyGo is an alternative compiler targeting the embedded systems and WebAssembly space. Contrary to the built-in Go compiler, WebAssemblies from TinyGo can be debugged in Chrome DevTools
Compiling Go source to WebAssembly in TinyGo
When compiled by TinyGo and run in the browser, the following code prints Go Web Assembly to the log console and exports a multiply function which can be invoked from JavaScript:
// main.go

package main

import "fmt"

func main() {
  fmt.Println("Go Web Assembly")
}

//export multiply
func multiply(x, y int) int {
  return x * y
}
Compile it to main.wasm with TinyGo:
tinygo build -o main.wasm main.goRun main.wasm in Chrome
wasm_exec.js contains helper functions provided by TinyGo. You’ll find the file in the targets directory of the TinyGo install directory. Copy it to the directory where you compiled main.wasm:
cp $TINYGO_INSTALL_DIR/targets/wasm_exec.js .Add the following html in the same directory and load it in Chrome:
<html>
<head>
<meta charset="utf-8" />
<script src="wasm_exec.js"></script>
<script>
const go = new Go();
const WASM_URL = 'main.wasm';
var wasm;
if ('instantiateStreaming' in WebAssembly) {
WebAssembly.instantiateStreaming(fetch(WASM_URL), go.importObject).then(function (obj) {
wasm = obj.instance;
go.run(wasm);
})
} else {
fetch(WASM_URL).then(resp =>
resp.arrayBuffer()
).then(bytes =>
WebAssembly.instantiate(bytes, go.importObject).then(function (obj) {
wasm = obj.instance;
go.run(wasm);
})
)
}
</script>
</head>
<body></body>
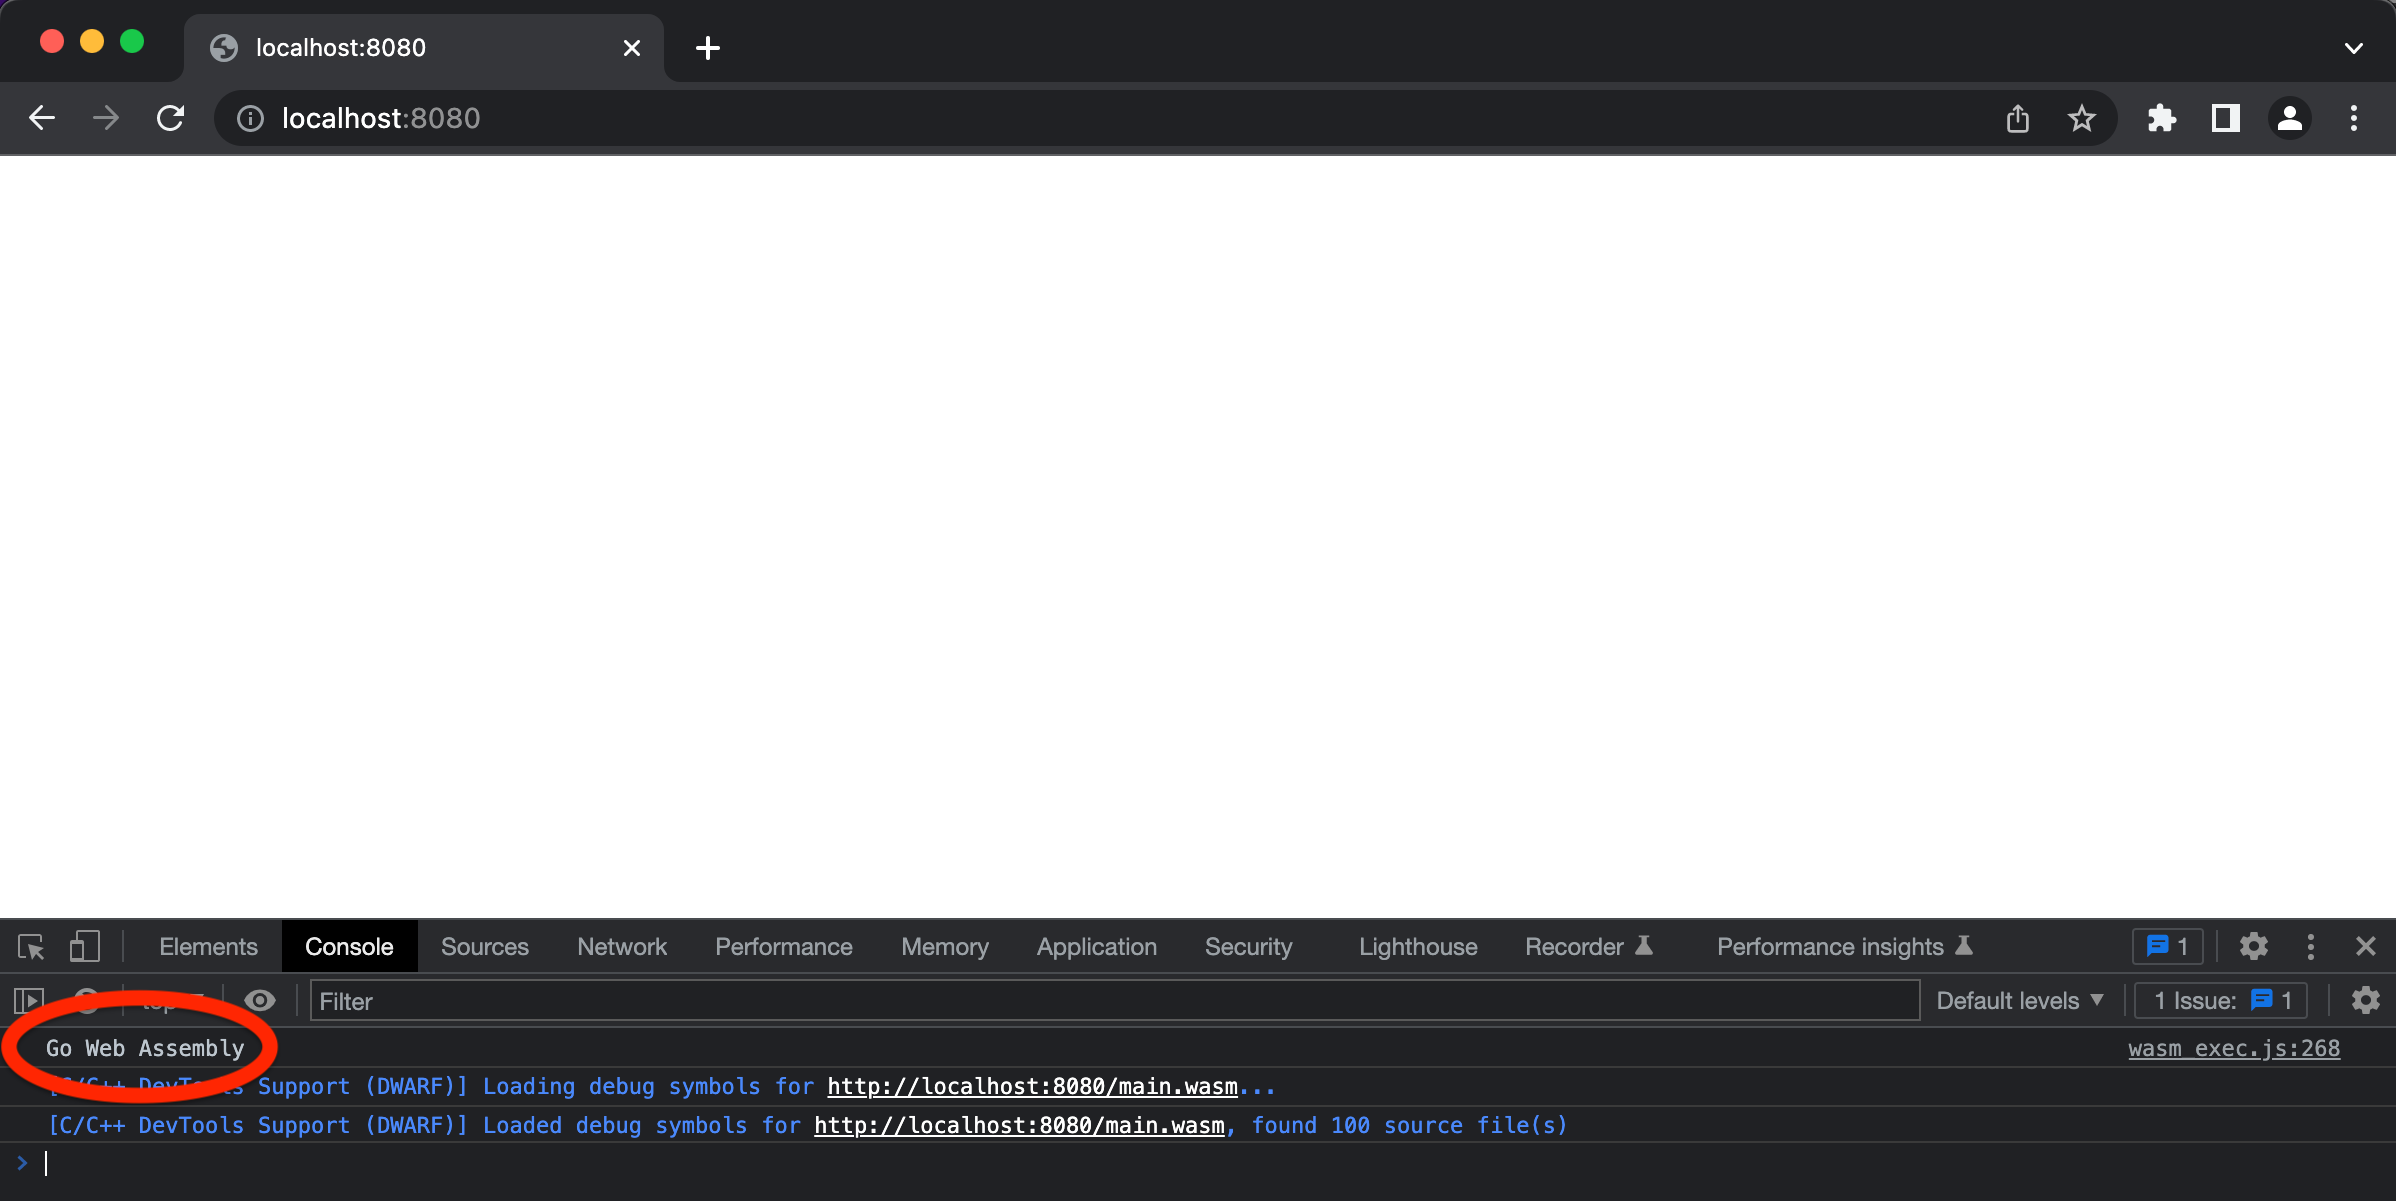
</html>You should see the Go Web Assembly message in the DevTools console:
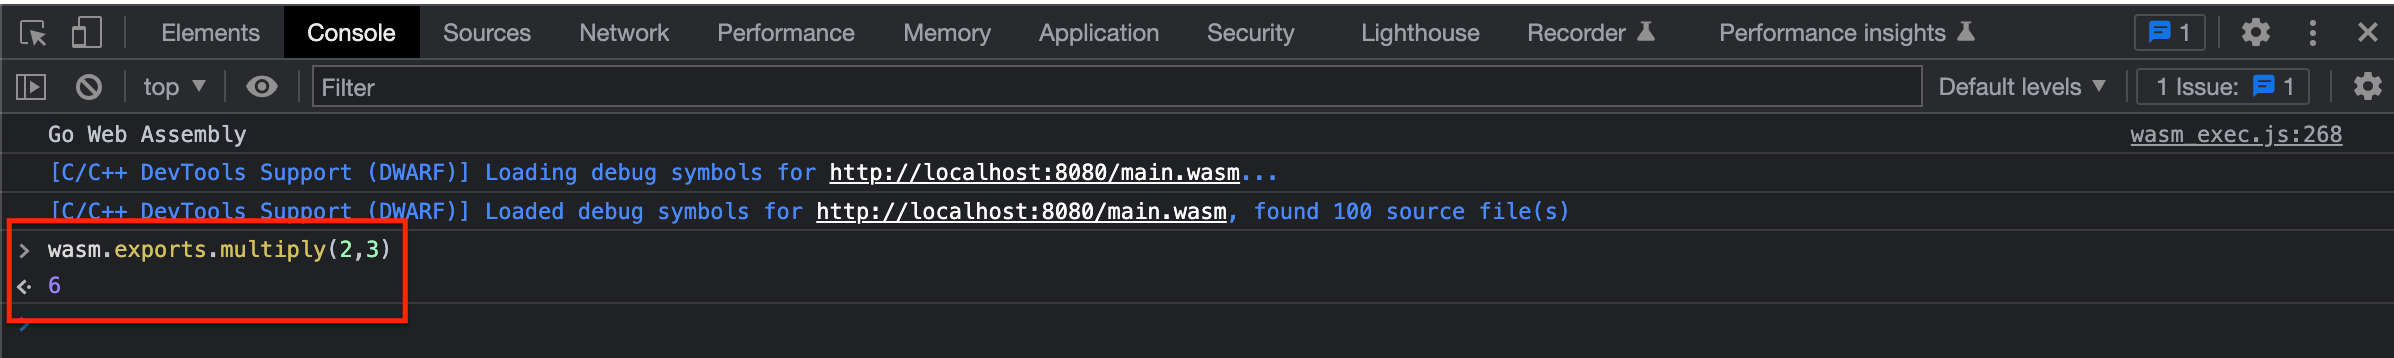
Invoke the multiply function from the DevTools console:
Enable Go debugging in Chrome DevTools
A helper extension that integrates with Chrome DevTools is needed. Please install it by going to this link. Although its current name suggests otherwise, the extension will work with Go sources
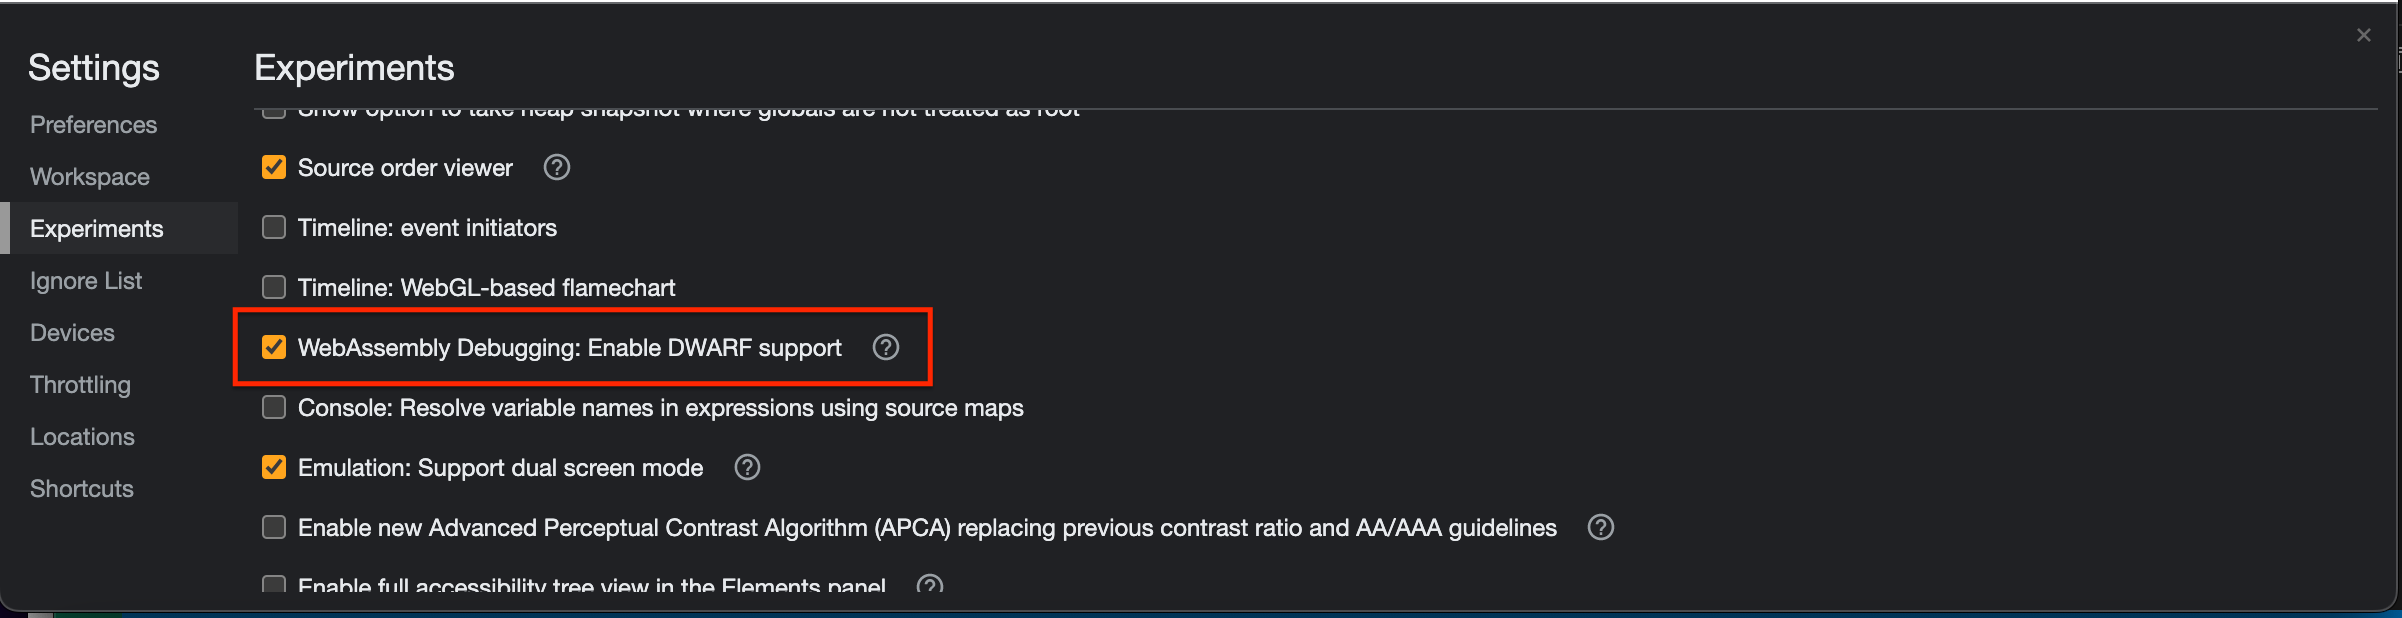
Finally, enable WebAssembly debugging in the DevTools Experiments. Open Chrome DevTools, click the gear (⚙) icon in the top right corner of DevTools pane, go to the Experiments panel and tick WebAssembly Debugging: Enable DWARF support:
Test Go debugging in Chrome DevTools
Make sure main.wasm is running in Chrome, as explained earlier
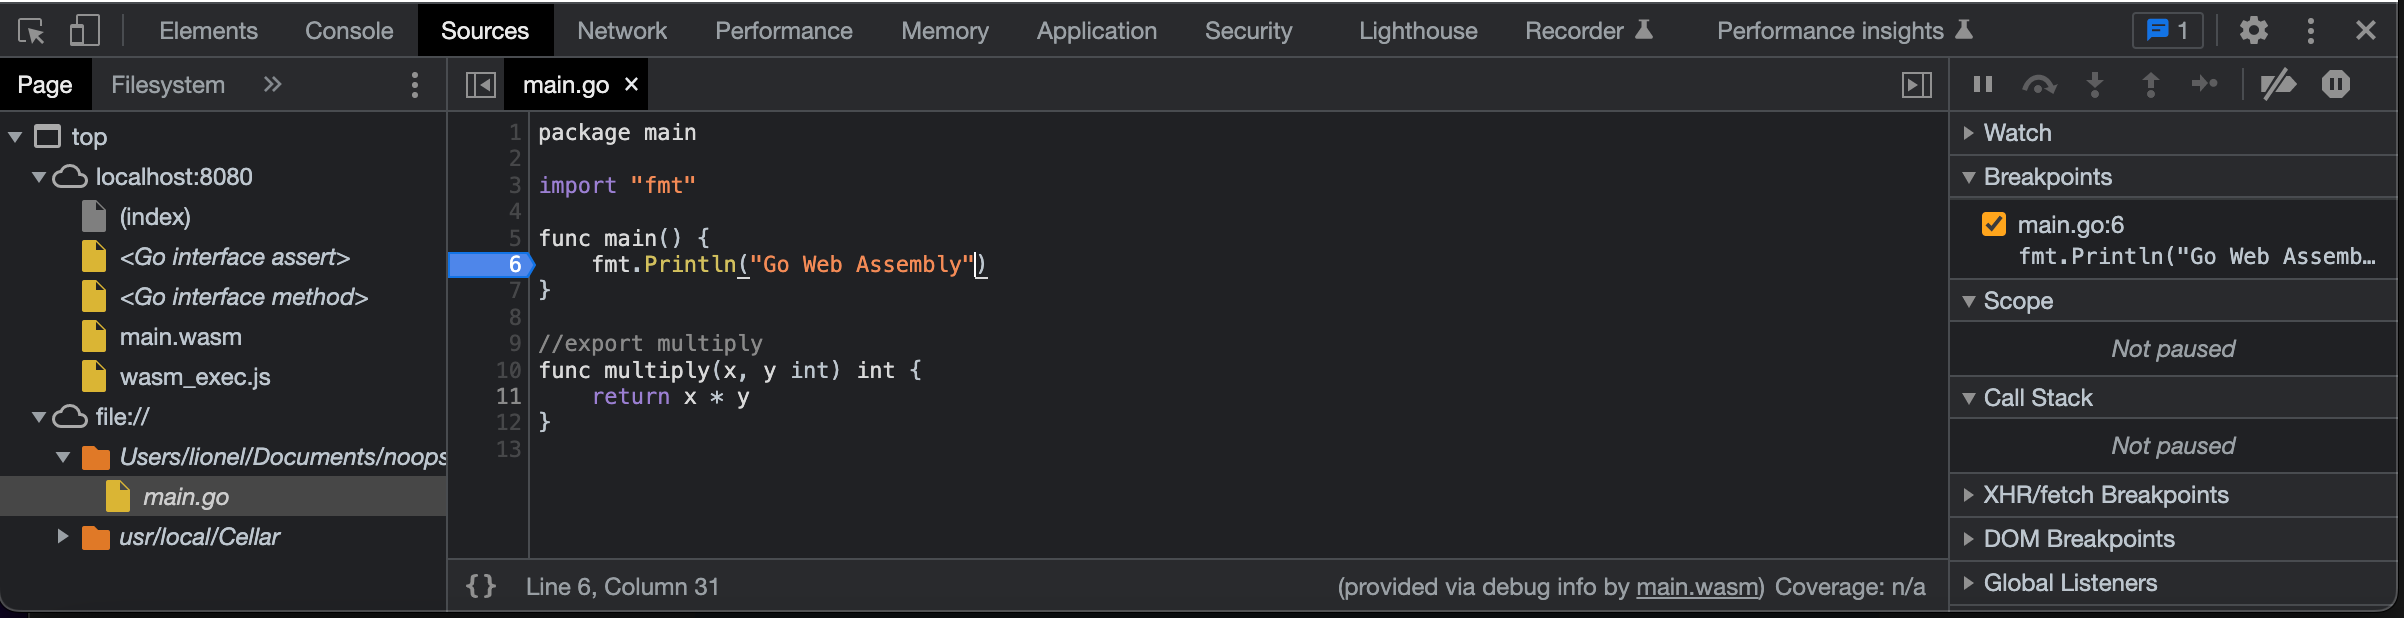
In Chrome DevTools, open the Sources tab. In the Page panel, open main.go from the file:// tree. Add a breakpoint on the fmt.Println("Go Web Assembly") line:
Reload the page. The debugger should be paused on the fmt.Println("Go Web Assembly") line:
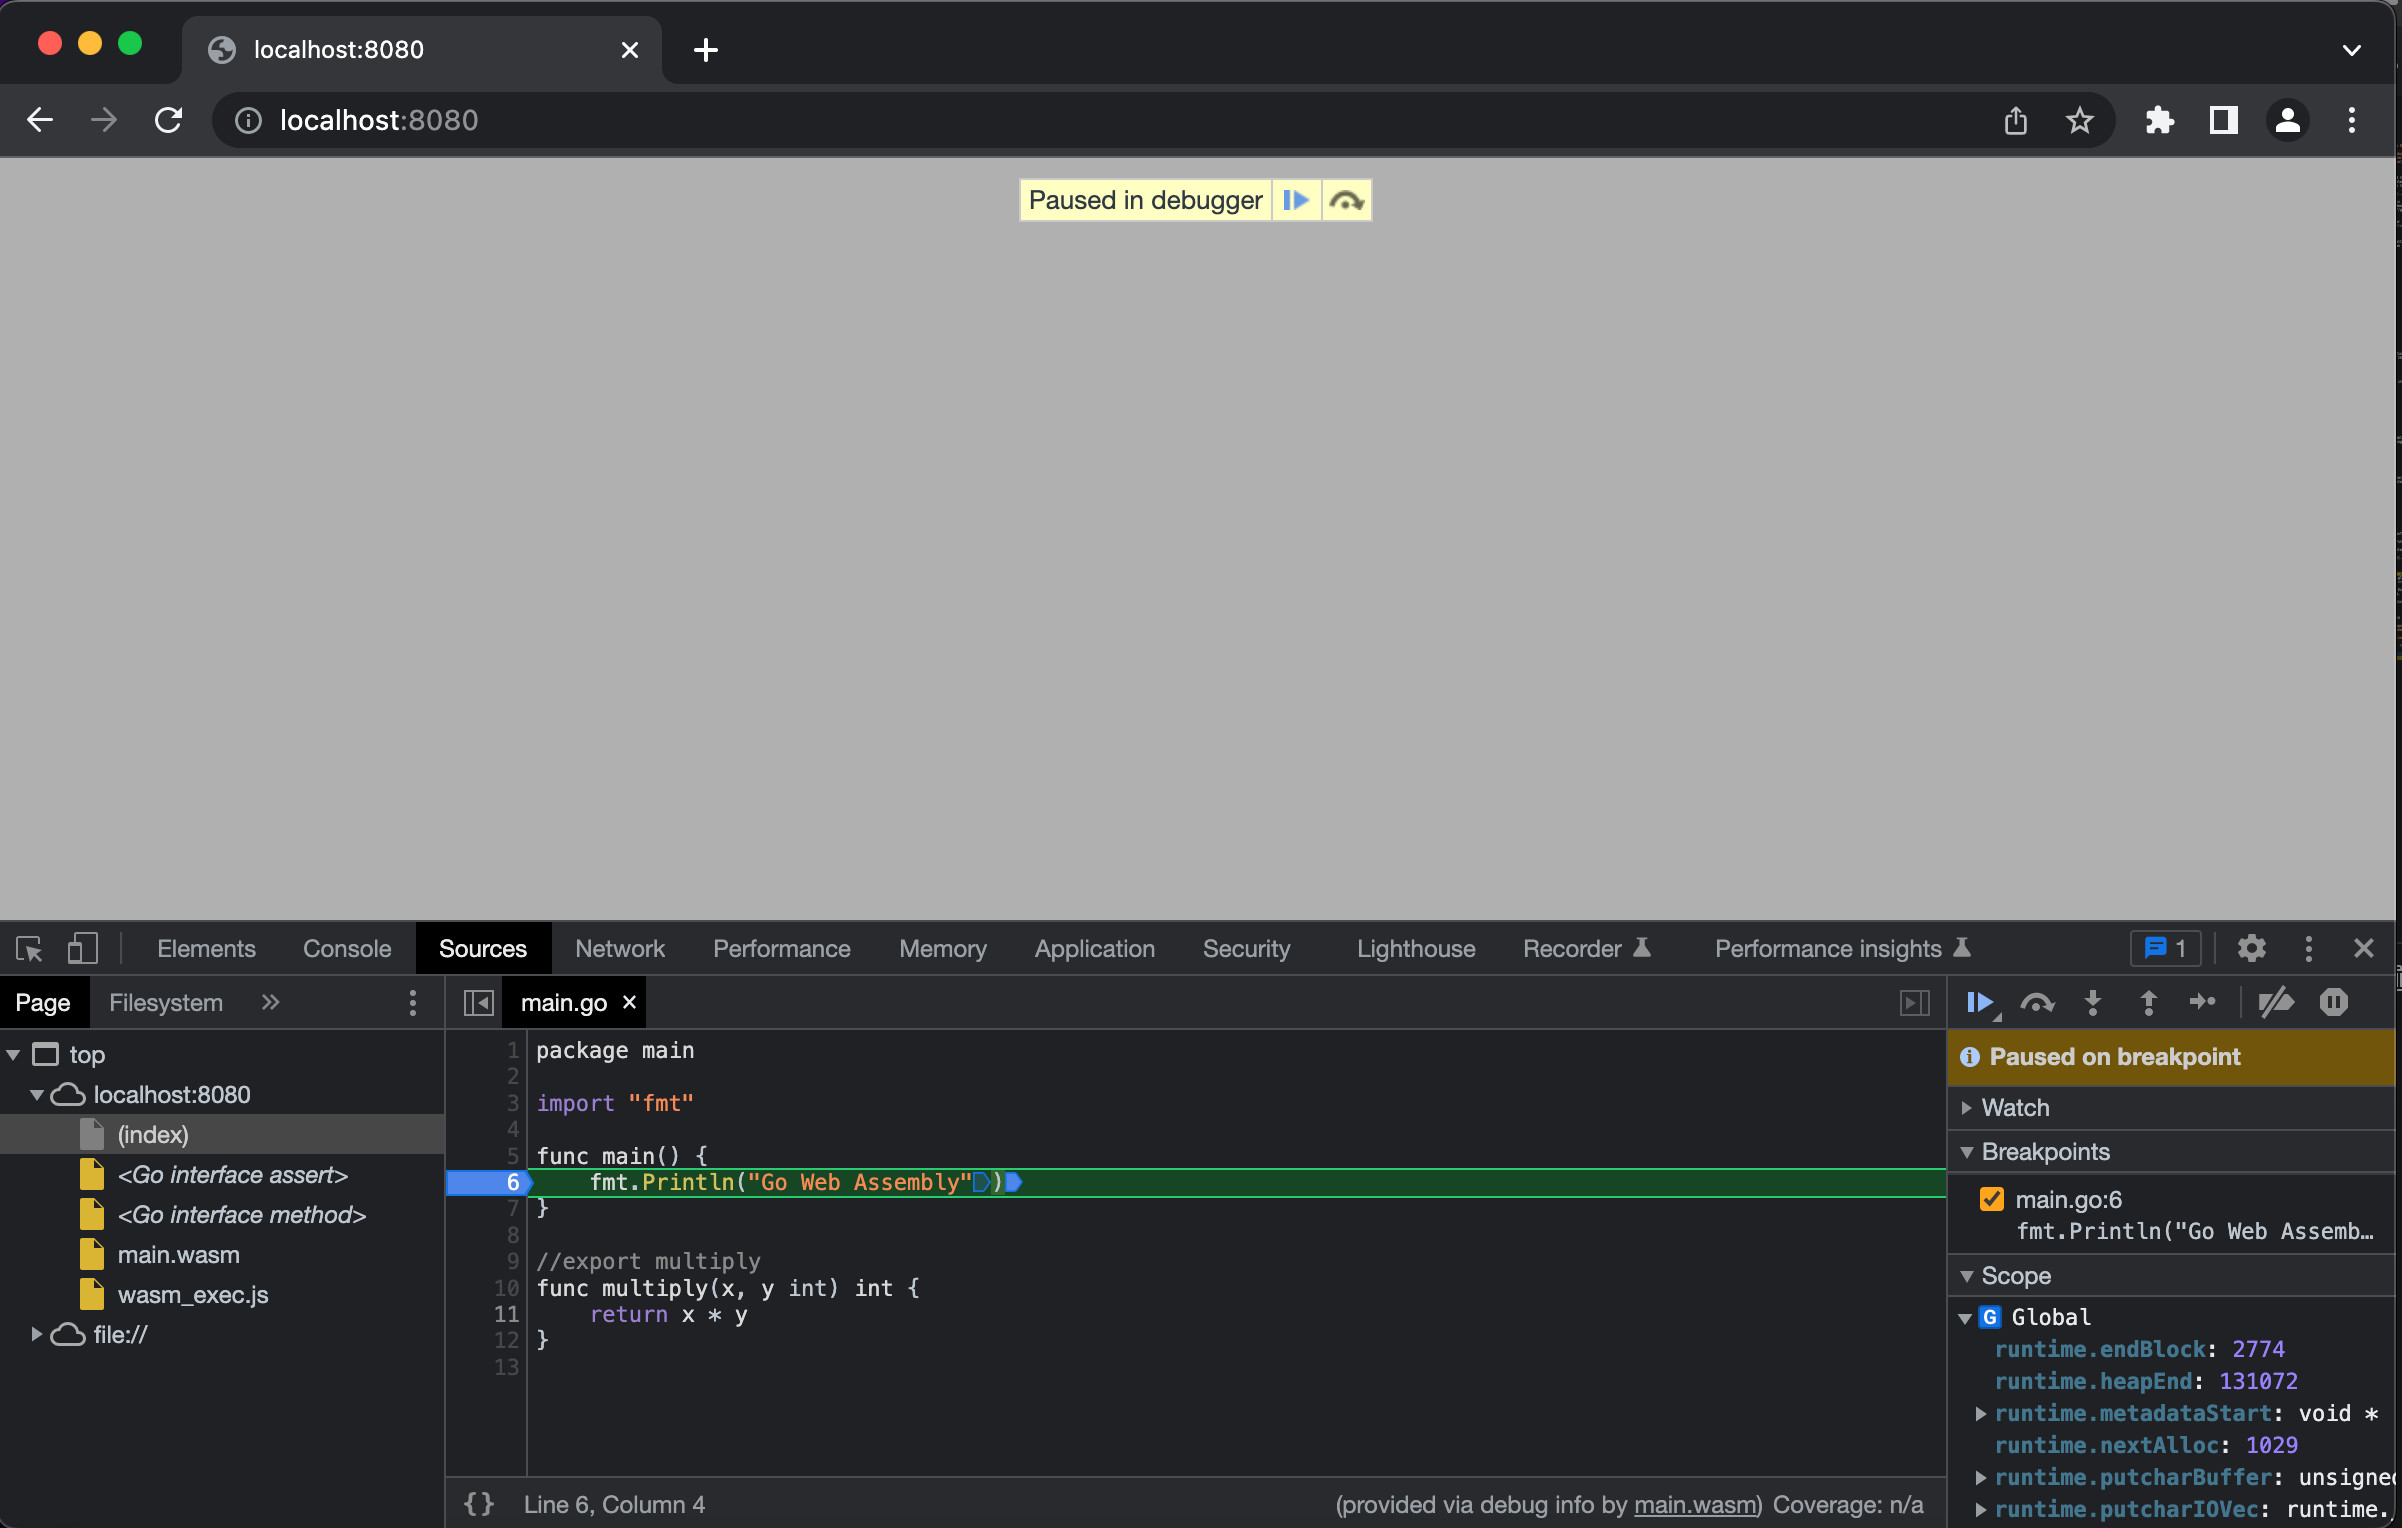
🚀